Tuesday, December 28, 2010

Rhea's Northern Craters


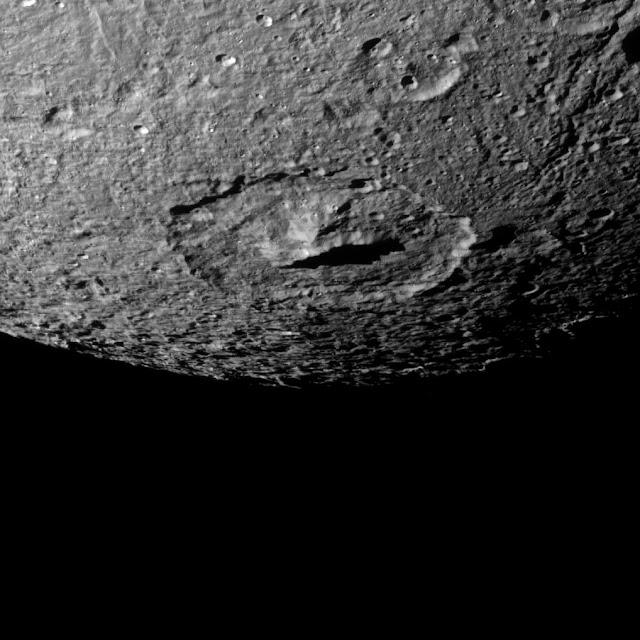
The Cassini spacecraft captured this high-resolution view of the cratered surface of Saturn's moon Rhea as the spacecraft flew by the moon on October 17, 2010.

For closer views of Rhea's surface from earlier flybys, see PIA07765 and PIA08402. This view is centered on terrain at 60 degrees North latitude, 251 degrees West longitude on Rhea (1,528 kilometers, 949 miles across).

The image was taken in visible light with the Cassini spacecraft's narrow-angle camera. The view was acquired at a distance of approximately 40,000 kilometers (25,000 miles) from Rhea and at a Sun-Rhea-spacecraft, or phase, angle of 88 degrees. Image scale is 238 meters (781 feet) per pixel.

Photo credit: NASA/JPL/Space Science Institute

Saturday, December 25, 2010

Saturn's Plasma and Radio Waves, as Seen by Cassini


This animation, derived from data obtained by NASA's Cassini spacecraft, shows how plasma swirling around Saturn is correlated to bursts of radio waves emanating from the planet. The data shown on the upper portion of the screen were obtained by the ion and neutral camera, part of the magnetospheric imaging instrument. When the plasma gets hot, it goes from red to white. The bottom part of the screen shows data from Cassini's radio and plasma wave subsystem. The data were obtained from 12:01 a.m. UTC to 11:55 a.m. UTC on October 7, 2008.

Video credit: NASA/JPL/JHUAPL/University of Iowa

Friday, December 24, 2010

Saturn's Hot Plasma Explosions


This animation based on data obtained by NASA's Cassini spacecraft shows how the "explosions" of hot plasma on the night side (orange and white) periodically inflate Saturn's magnetic field (white lines). Cassini scientists have been able to compute the "pressure" that the hot plasma exerts on the surrounding magnetic field by using remote images of the previously invisible hot plasma taken by the ion and neutral camera, part of the magnetospheric imaging instrument on board Cassini.

These enormous clouds of hot plasma recur in the part of the magnetosphere known as the magnetotail roughly every 10 to 11 hours. They rotate around Saturn at a distance of about eight to 15 times the radius of Saturn. Scientists have finally been able to demonstrate that the pressure contained in these clouds is sufficient to inflate the magnetic field in a manner that is consistent with the periodic magnetic field signals that have puzzled them for so long. As the high- and low-pressure systems of atmospheric weather on Earth produce winds, pressures in space produce huge electrical currents, which in turn distort the magnetic field.

The animation is based on data that were collected from December 17 to 18, 2004.

Video credit: NASA/JPL/JHUAPL/University of Iowa

Note: For more information, see Hot Plasma Explosions Inflate Saturn's Magnetic Field.

Wednesday, December 22, 2010

Rhea's Western Wisps


Icy fractures on Saturn's moon Rhea reflect sunlight brightly in this high-resolution mosaic created from images captured by NASA's Cassini spacecraft during its March 2, 2010, flyby. This flyby was the closest flyby of Rhea up to then.

This mosaic of six images shows the westernmost portion of the moon's "wispy" terrain. (See PIA06578 and PIA08120 to learn more.) Among the interesting features depicted here is a very straight east-west fracture near the top center of the mosaic that intersects two north-south fractures. The large crater at the bottom left of the mosaic is Inmar (55 kilometers, 34 miles across).

The closest approach of the spacecraft to Rhea during this encounter was 100 kilometers (62 miles). These images were obtained approximately half an hour later at an altitude of about 16,000 kilometers (10,000 miles).

This mosaic shows part of the side of Rhea (1528 kilometers, 949 miles across) that always faces Saturn. The images were re-projected in an orthographic projection centered on terrain at 7 degrees North latitude, 296 degrees West longitude. The mosaic itself shows terrain centered on terrain at 6 degrees North latitude, 293 degrees West longitude. North on Rhea is roughly up in the image.

The images were taken with the Cassini spacecraft narrow-angle camera. The view was obtained at a Sun-Rhea-spacecraft, or phase, angle of 2 degrees. So, Cassini was almost directly between Rhea and the Sun as it acquired these images. Image scale is 85 meters (280 feet) per pixel.

Photo credit: NASA/JPL/Space Science Institute

Seven Lacuna Names Approved for Use on Titan

From the USGS Astrogeology Science Center:

Seven names with the descriptor term lacuna have been approved for use on Titan. For more information, see the list of Titan lacunae and the map of the north polar region of Titan in the Gazetteer of Planetary Nomenclature.

Note: The official definition of a lacuna (pl., lacunae) is an "Irregularly shaped depression on Titan having the appearance of a dry lake bed." The seven new lacunae are: Atacama Lacuna, Eyre Lacuna, Jerid Lacuna, Melrhir Lacuna, Ngami Lacuna, Racetrack Lacuna and Uyuni Lacuna.

Tuesday, December 21, 2010

Titan and Tethys


The Cassini spacecraft watches a pair of Saturn's moons, showing the hazy orb of giant Titan beyond smaller Tethys.

In the foreground of the image, Ithaca Chasma can be seen running roughly north-south for more than 1,000 kilometers (620 miles) on Tethys. See PIA07734 for a closer view. Titan's detached, high-altitude haze layer and north polar hood are also visible here. See PIA09739 and PIA08137 to learn more.

This view looks toward the Saturn-facing sides of Titan (5,150 kilometers, or 3,200 miles across) and Tethys (1,062 kilometers, or 660 miles across).

The image was taken in visible green light with the Cassini spacecraft narrow-angle camera on October 18, 2010. The view was obtained at a distance of approximately 2.5 million kilometers (1.6 million miles) from Titan and at a Sun-Titan-spacecraft, or phase, angle of 55 degrees. The view was obtained at a distance of approximately 1.5 million kilometers (930,000 miles) from Tethys and at a Sun-Tethys-spacecraft, or phase, angle of 55 degrees. Image scale is 15 kilometers (9 miles) per pixel on Titan and 9 kilometers (6 miles) per pixel on Tethys.

Photo credit: NASA/JPL/Space Science Institute

Thursday, December 16, 2010

Titan's Sotra Facula


This movie is based on data from NASA's Cassini spacecraft and shows a flyover of an area of Saturn's moon Titan known as Sotra Facula. Scientists believe Sotra is the best case for an ice volcano -- or cryovolcano -- region on Titan.

The flyover shows two peaks more than 1,000 meters (3,000 feet) tall and multiple craters as deep as 1,500 meters (5,000 feet). It also shows finger-like flows. All of these are land features that indicate cryovolcanism. The 3-D topography comes from Cassini's radar instrument. Topography has been vertically exaggerated by a factor of 10. The false color in the initial frames shows different compositions of surface material as detected by Cassini's visual and infrared mapping spectrometer. In this color scheme, dunes tend to look relatively brown-blue. Blue suggests the presence of some exposed ice. Scientists think the bright areas have an organic coating that hides the ice and is different and lighter than the dunes. The finger-like flows appear bright yellowish-white, like the mountain and caldera. The second set of colors shows elevation, with blue being lowest and yellow and white being the highest. Dunes here appear blue because they tend to occupy low areas. The finger-like flows are harder to see in the elevation data, indicating that they are thin, maybe less than about 100 meters (300 feet) thick.


Photo credit: NASA/JPL-Caltech/USGS/University of Arizona

Notes: For a map showing Sotra Facula's location on Titan, see PIA13696: Global View of Sotra Facula, Titan. Also, this is Saturnology's 100th post!

Wednesday, December 15, 2010

Saturn, Rhea and Shadows


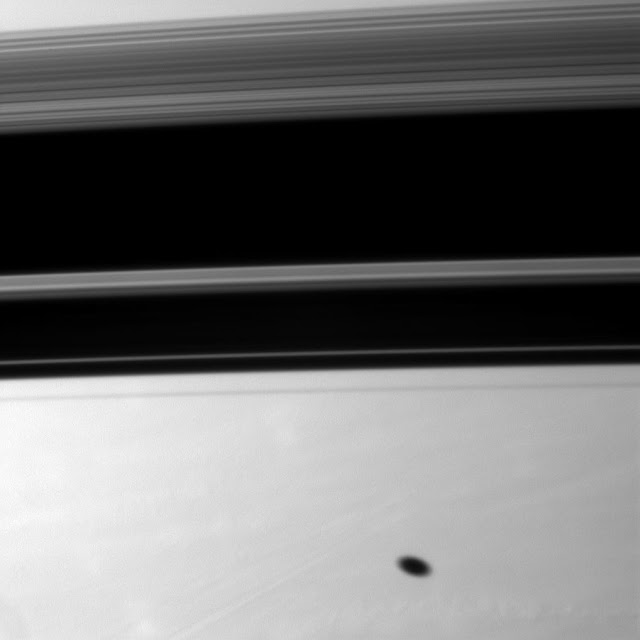
Shadows adorn Saturn in this Cassini spacecraft view, which also includes the moon Rhea.

Rhea (1,528 kilometers, 949 miles across) is shown orbiting between the planet and the spacecraft and appears above the rings on the left of the image. As Saturn's northern hemisphere experiences spring, the rings now cast a shadow onto the southern hemisphere. The moon Mimas casts a small shadow on the planet south of shadows cast by the rings. The larger, elongated shadow farther south is cast by the moon Dione. Mimas and Dione are not shown.

This view looks toward the southern, unilluminated side of the rings from about 1 degree below the ringplane.

The image was taken in visible red light with the Cassini spacecraft wide-angle camera on October 22, 2010. The view was obtained at a distance of approximately 2.4 million kilometers (1.5 million miles) from Saturn and at a Sun-Saturn-spacecraft, or phase, angle of 84 degrees. Image scale is 141 kilometers (88 miles) per pixel.

Photo credit: NASA/JPL/Space Science Institute

Tuesday, December 7, 2010

Dione's Erulus Crater


The Cassini spacecraft snapped this shot of cratered Dione as it flew by the Saturnian moon on October 17, 2010.

The large crater at the center of the image is Erulus, which is about 120 kilometers, or 75 miles, across. This view looks toward the southern latitudes of the leading hemisphere of Dione (1,123 kilometers, or 698 miles across).

The image was taken in visible light with the Cassini spacecraft narrow-angle camera. The view was acquired at a distance of approximately 41,000 kilometers (25,000 miles) from Dione and at a Sun-Dione-spacecraft, or phase, angle of 53 degrees. Image scale is 240 meters (787 feet) per pixel.

Photo credit: NASA/JPL/Space Science Institute

Monday, December 6, 2010

Map of Tethys


This global map of Saturn's moon Tethys was created using images taken by NASA's Cassini spacecraft.

This map is an update to the version released in February 2010 (see PIA12560). New data collected during Cassini's August 14, 2010, flyby of the moon are used to fill in the far northern latitudes of the map from about 75 degrees north latitude to the north pole. Coverage also improves farther south on the side of the moon facing away from Saturn. That improved coverage starts at about 40 degrees north latitude and stretches north to the pole in the area roughly west of the large Odysseus Crater (between 160 degrees and 260 degrees west longitude).

The map is an equidistant (simple cylindrical) projection and has a scale of 293 meters (960 feet) per pixel at the equator in the full size version. The mean radius of Tethys used for projection of this map is 536.3 kilometers (333.2 miles). The resolution of the map is 32 pixels per degree.

Photo credit: NASA/JPL/Space Science Institute
Note: For the polar views, click here for the northern hemisphere and here for the southern hemisphere.

Sunday, December 5, 2010

Damascus Sulcus Hot Spot


Data from NASA's Cassini spacecraft have enabled scientists to make the highest-resolution heat intensity maps yet for the hottest part of a "tiger stripe" fissure on Saturn's moon Enceladus. The moon's south polar region features several of these long fissures that spray water and icy particles, and the one in this image is called Damascus Sulcus.

The thermal infrared data, shown in color, come from Cassini's composite infrared spectrometer (CIRS). The grayscale background image, which is illuminated by light reflected from Saturn rather than by direct sunlight, is from Cassini's high-resolution imaging camera (ISS). The CIRS scan gives scientists confidence that the peak temperature along Damascus Sulcus, the most active tiger stripe, was about 190 Kelvin (minus 120 degrees Fahrenheit). This temperature is slightly higher than the previous maximum temperatures measured by CIRS at Damascus, which were around 170 Kelvin (minus 150 degrees Fahrenheit).

The intensity of heat radiation, measured by CIRS at wavelengths from 7 to 9 microns, is color-coded, with blue, purple, red, orange and yellow denoting progressively more intense radiation, due to higher temperatures and/or larger expanses of warm material. The image is centered near 80 degrees South latitude and 315 degrees West longitude, and covers a region about 16 kilometers (10 miles) wide. The smallest details seen in the CIRS overlay are about 800 meters (0.5 miles) in size.

The region of peak temperature is sharply bounded by the sides of the trench. Thanks to its high resolution, the CIRS map also shows for the first time that the regions on either side of the central trench are also radiating heat (shown as blue strips flanking the central multicolored strip in this image). CIRS measured temperatures of about 120 Kelvin (minus 240 degrees Fahrenheit) in the flanking regions about 400 to 1,200 meters (a quarter to three-quarters of a mile) away from the central trench.

These data were obtained on August 13, 2010 as the south pole of Enceladus began to go into winter darkness.

Photo credit: NASA/JPL/GSFC/SWRI/SSI

Saturday, December 4, 2010

Geology of Tethys


Geologic faults among craters on Saturn's moon Tethys are depicted in this image captured during a flyby of the moon by NASA's Cassini spacecraft on August 14, 2010.

The brightly illuminated, prominent impact crater near the bottom middle of this image has been dissected by numerous parallel faults that run diagonally across the image. The presence of the faults that cut through the crater and the movement of surface materials have made the crater outline somewhat non-circular. Near the center of the image, running diagonally from the left to right, is an old graben, or linear depression of terrain between faults. See PIA07736 and PIA07734 for images showing geologic features on Tethys taken during an earlier flyby.

Below these faults and near the middle top of the image is a large ancient impact crater that is so highly overprinted by more recent craters that it can barely be recognized.

On the left of the image, there are some horizontal lines that can be seen very faintly cutting across craters. These lines are artifacts of missing data in the raw image that could not be eliminated through processing the image.

This view looks toward the leading hemisphere of Tethys (1062 kilometers, 660 miles across). The view is centered on terrain at 59 degrees North latitude, 79 degrees West longitude.

The image was taken in visible light with the Cassini spacecraft narrow-angle camera. The view was acquired at a distance of approximately 40,000 kilometers (25,000 miles) from Tethys and at a Sun-Tethys-spacecraft, or phase, angle of 103 degrees. Image scale is 234 meters (767 feet) per pixel.

Photo credit: NASA/JPL/Space Science Institute

Friday, December 3, 2010

Enceladus Tiger Stripe Hot Spots


This image shows a high-resolution heat intensity map of part of the south polar region of Saturn's moon Enceladus, made from data obtained by NASA's Cassini spacecraft.

The map reveals never-before-seen details of warm fractures that branch off like split ends from the ends of the main trenches of two "tiger stripes." The features nicknamed "tiger stripes" are long fissures that spray water vapor and icy particles. These two fissures, Cairo Sulcus (left) and Alexandria Sulcus (right), extend to the lower right, off the bottom of the image. The map also shows an intriguing isolated warm spot, shown in purple-red in the upper left of the image, that is separated from other active fissures.

The thermal data came from Cassini's composite infrared spectrometer during an August 13, 2010, flyby of Enceladus. Scientists overlaid the data on a background map of that region made from Cassini images taken in July 2005. The intensity of thermal radiation, measured at wavelengths from 12 to 16 microns, is color-coded, with dark blue, purple, red and orange denoting progressively more intense radiation, due to higher temperatures and/or larger expanses of warm material. The pale blue color indicates regions that were mapped but that were too cold to emit significant radiation. Alignment of the thermal map with the underlying base map is approximate. The map shows a region approximately 130 kilometers (80 miles) across.

These data were obtained as winter darkness began to engulf the south polar region of Enceladus. Away from the warm tiger stripes, which reach temperatures up to 190 Kelvin (minus 120 degrees Fahrenheit), Cassini measured surface temperatures near Enceladus' south pole as low as 52 Kelvin (minus 365 degrees Fahrenheit), and still colder temperatures are expected as winter advances. Scientists are still analyzing the data to calculate a temperature for the cross-cutting fractures and the isolated warm spot.

Image credit: NASA/JPL/GSFC/SWRI/SSI

Looming Enceladus


Small water ice particles fly from fissures in the south polar region of Saturn's moon Enceladus in this image taken during the August 13, 2010, flyby of the moon by NASA's Cassini spacecraft.

This view looks toward the night side of Saturn, which is in the lower left of the image. Enceladus, in the top right, is closer to the spacecraft than the planet is in this view. Sunlight scatters through the planet's atmosphere and forms the bright diagonal line running from the left to bottom right of the image. The atmosphere appears layered here. Scientists think the different layers on the limb are real and not an artifact of the camera's exposure.

The famous jets, imaged by Cassini's cameras for the first time in 2005, are faintly seen here erupting from the fractures that cross the south polar region of the moon.

Illuminated terrain seen on Enceladus is on the leading hemisphere of the moon, or the side facing forward in the moon's orbit around Saturn. North on Enceladus (504 kilometers, 313 miles across) is up. The jets appear faint here, but can be seen near the center of the image. See PIA11688 to learn more.

The image was taken in visible light with the Cassini spacecraft narrow-angle camera. The view was obtained at a distance of approximately 59,000 kilometers (37,000 miles) from Enceladus and at a Sun-Enceladus-spacecraft, or phase, angle of 155 degrees. Image scale on Enceladus is 353 meters (1,157 feet) per pixel.

Photo credit: NASA/JPL/Space Science Institute

Thursday, December 2, 2010

Enceladus Before Saturn's Limb


Jets of water ice particles spew from Saturn's moon Enceladus in this image obtained by NASA's Cassini spacecraft on August 13, 2010. A crescent of the moon appears dimly illuminated in front of the bright limb of Saturn.

This view looks toward the night side of Saturn, which occupies the lower half of the image. Enceladus, in the center of the image, is closer to the spacecraft than the planet is in this view. Sunlight scatters through the planet's atmosphere and forms the bright diagonal line running from the left to right of the image. Lit terrain seen on Enceladus (504 kilometers, 313 miles across) is on the leading hemisphere of the moon. North on Enceladus is up.

The jets erupting from the south polar region appear faint here, but can be seen at the bottom of the crescent of the moon. See PIA11688 to learn more.

The image was taken in visible light with the Cassini spacecraft wide-angle camera. The view was acquired at a distance of approximately 61,000 kilometers (38,000 miles) from Enceladus and at a Sun-Enceladus-spacecraft, or phase, angle of 155 degrees. Image scale is 4 kilometers (2 miles) per pixel.

Photo credit: NASA/JPL/Space Science Institute

Tuesday, November 30, 2010

Superimposed Craters on Rhea


The two large craters on the right of this image are overprinted with smaller, more recent craters in this Cassini spacecraft view of Saturn's moon Rhea.

Rhea, at 1,528 kilometers, or 949 miles, across, is Saturn's second largest moon. This view is centered on terrain at 17 degrees South latitude, 235 degrees West longitude.

The image was taken in visible light with the Cassini spacecraft narrow-angle camera on October 17, 2010. The view was acquired at a distance of approximately 44,000 kilometers (27,000 miles) from Rhea. Image scale is 259 meters (850 feet) per pixel.

Photo credit: NASA/JPL/Space Science Institute

Tuesday, November 23, 2010

Sextet of Moons


Six of Saturn's moons orbiting within and beyond the planet's rings are collected in this Cassini spacecraft image.

Enceladus (504 kilometers, or 313 miles across) is the largest moon in this image and appears at the bottom. Janus (179 kilometers, or 111 miles across) orbits beyond the rings near the center of the image. Epimetheus (113 kilometers, or 70 miles across) orbits beyond the rings near the top of the image. Atlas (30 kilometers, or 19 miles across) appears as a tiny speck between the main rings and the thin F ring on the right. Daphnis (8 kilometers, or 5 miles across), which orbits in the narrow Keeler Gap of the A ring, appears as a small, bright speck on the left of the image. Pan (28 kilometers, or 17 miles across), which orbits in the Encke Gap of the A ring, also appears as a bright speck on the left of the image. Daphnis is farther to the left of the image than Pan.

Although Enceladus appears to be in the foreground here, that moon, at a distance of 3.1 million kilometers (1.9 million miles), is actually farthest away from Cassini in this image. Janus is 3 million kilometers (1.9 million miles) from the spacecraft. The view was obtained at a distance of approximately 2.8 million kilometers (1.7 million miles) from Epimetheus.

The rings lie between Janus and Epimetheus. This view looks toward the southern, unilluminated side of the rings from about 2 degrees below the ringplane.

Enceladus is a very reflective body. To enhance visibility, the other moons and the rings have been brightened by a factor of 3.4 relative to Enceladus.

The image was taken in visible light with the Cassini spacecraft narrow-angle camera on October 6, 2010. Image scale is approximately 19 kilometers (12 miles) per pixel on Enceladus, about 18 kilometers (11 miles) per pixel on Janus and about 17 kilometers (11 miles) per pixel on Epimetheus.

Photo credit: NASA/JPL/Space Science Institute

Friday, November 19, 2010

Unexpected Chevron Structure on the Edge of Saturn's B-Ring


The outer edge of Saturn's B ring exhibits an unexpected feature in this movie made from images captured by NASA's Cassini spacecraft. The images were obtained early in the planet's equinox "season" -- the period leading up to and away from August 11, 2009 when the Sun was over the planet's equator and lit the rings exactly edge on.

The B ring is shown at the top of the frame. The Cassini Division, a low-density region that separates the A and B rings, dominates the middle of the frame. The inner A ring is at the bottom.

It is apparent in the movie that the outer B ring edge location varies with time. For a more detailed view and explanation for this behavior, see PIA12794.

But, about halfway through, an unusual, 20,000-kilometer-long (12,000-mile-long), chevron-shaped structure can be seen moving along the B ring edge. Higher resolution images, taken during equinox, have shown that this region is the site of vertical structures, as tall as 3.5 kilometers (2.2 miles), whose existence was betrayed by long shadows (see PIA11668).

Cassini imaging scientists found that this chevron feature is one of two sites at the B ring's outer edge that does not follow any of the three newly discovered rotating patterns distorting the ring's edge or another pattern previously known to be caused by the moon Mimas. They have found instead that it orbits Saturn as would an independently orbiting body. As a result, scientists conclude that these are likely sites of massive bodies, or moonlets, embedded near the ring's edge but independently orbiting Saturn. In the particular region shown in this movie, the moonlets are likely big enough to cause ring material streaming past them to be excessively compressed and thrown vertically as a result. The moonlets themselves can't be seen.

This interpretation is supported by Cassini's previous discovery of a moonlet embedded in this region of the B ring (see PIA11665). The imaged moonlet, whose size is estimated at 300 meters (1,000 feet) across, was found only because it was betrayed by the shadow it cast during Saturn's August 2009 equinox period.

This view looks toward the southern, sunlit side of the rings from about 4 degrees below the ring plane.

The movie is a concatenation of 39 images taken about 2 minutes, 40 seconds apart, over the span of 1 hour, 40 minutes. The images, taken on February 25, 2009, were re-projected into the same viewing geometry.

...

The images were taken in visible light with the Cassini spacecraft narrow-angle camera. The view was obtained at a distance of approximately 822,000 kilometers (511,000 miles) from Saturn and at a Sun-Saturn-spacecraft, or phase, angle of 154 degrees. Image scale is 5 kilometers (3 miles) per pixel.

Video credit: NASA/JPL/Space Science Institute

Note: A continuous loop video of the chevron structure can be found here.

Wednesday, November 17, 2010

Vertical Structures in Saturn's B-Ring


Vertical structures, among the tallest seen in Saturn's main rings, rise abruptly from the edge of Saturn's B ring to cast long shadows on the ring in this image taken by NASA's Cassini spacecraft two weeks before the planet's August 2009 equinox.

Part of the Cassini Division, between the B and the A rings, appears at the top of the image, showing ringlets in the inner division.

In this image, Cassini's narrow angle camera captured a 1,200-kilometer-long (750-mile-long) section arcing along the outer edge of the B ring. Here, vertical structures tower as high as 2.5 kilometers (1.6 miles) above the plane of the rings -- a significant deviation from the vertical thickness of the main A, B and C rings, which is generally only about 10 meters (about 30 feet).

Cassini scientists believe that this is one prominent region at the outer edge of the B ring where large bodies, or moonlets, up to a kilometer or more in size, are found. It is possible that these bodies significantly affect the ring material streaming past them and force the particles upward, in a "splashing" manner.

This image and others like it (see PIA11669) are only possible around the time of Saturn's equinox, which occurs every half-Saturn-year, or about every 15 Earth years. The illumination geometry that accompanies equinox lowers the Sun's angle to the ring plane and causes structures jutting out of the plane to cast long shadows across the rings. The "season" of equinox allows shadows to appear on the rings in the months before and after equinox, but the actual equinox occurred August 11, 2009, as the Sun shone directly edge-on to the ring plane.

This view looks toward the southern, sunlit side of the rings from about 32 degrees below the ring plane.

The image was taken in visible light with the Cassini spacecraft narrow-angle camera on July 26, 2009. The view was acquired at a distance of approximately 336,000 kilometers (209,000 miles) from Saturn and at a Sun-Saturn-spacecraft, or phase, angle of 132 degrees. Image scale is 2 kilometers (1 mile) per pixel.

Photo credit: NASA/JPL/Space Science Institute

Tuesday, November 16, 2010

Dione's "Wisps"


The Cassini spacecraft looks across the surface of Saturn's moon Dione and details the "wispy" terrain first chronicled by Voyager.

This fractured terrain covers the trailing hemisphere of Dione (1,123 kilometers, or 698 miles across). See PIA10560 to learn more. This view is centered on terrain at 53 degrees north latitude, 209 degrees west longitude.

The image was taken in visible light with the Cassini spacecraft narrow-angle camera on October 17, 2010. The view was acquired at a distance of approximately 61,000 kilometers (38,000 miles) from Dione and at a Sun-Dione-spacecraft, or phase, angle of 32 degrees. Image scale is 363 meters (1,190 feet) per pixel.

Photo credit: NASA/JPL/Space Science Institute

Monday, November 15, 2010

Galactic Behavior for the Outer B Ring


Keeping a close watch on the outer portion of Saturn's B ring, NASA's Cassini spacecraft records the complex inward and outward movement of the edge of the ring. This ring movement resembles the suspected behavior of spiral disk galaxies.

The position of the outer edge of the B ring, shown here crossing the middle of the frame, varies with time in this concatenation of 301 images taken an average of 1 minute, 50 seconds apart, over the span of about nine hours. The total variation of the edge, from the innermost to outermost locations, is 200 kilometers (120 miles). The eccentric Huygens Ringlet, another very narrow ringlet discovered by Cassini, and the innermost of the bands of ring material in the Cassini Division, a low-density region once thought to be empty, all appear in the top of the frame.

Cassini scientists have determined that the complicated radial variations in the B ring edge are caused by the presence of four scalloped patterns, all independently moving around the ring. One pattern, with two lobes, is present because of the gravitational perturbations from the moon Mimas, which alter the ring particle orbits because of a repetitive configuration of particle and satellite orbital positions known as a Lindblad resonance; this pattern always stays fixed with respect to Mimas.

The other patterns with one, two, and three lobes respectively, travel around the ring with differing speeds and are believed to be natural modes of oscillation of the ring in this vicinity, excited by a process known as "viscous overstability." In this process, the small, random motions of the ring particles feed energy into a wave that propagates outward across the ring from an inner boundary, reflects off the outer edge of the B ring (which becomes distorted as a result), and then travels inward until it reflects off the inner boundary. This continuous back-and-forth reflection is necessary for these wave patterns to grow and become visible as distortions in the outer edge of the B ring.

In supporting these so-called "self-excited" modes, the outer edge of the B ring is behaving the way astronomers believe spiral galaxies behave. However, such modes are not directly observable in galaxies. Cassini's observations of the outer B ring edge constitute the first time such large-scale modes in a broad disk of material have been observed in nature.

The movie repeats twice. The second time the movie runs, the location of the Mimas resonance (marked with a green line), the locations of the inner boundaries for the one-lobed (blue), two-lobed (yellow), and three-lobed (red) modes, and the location of the mean radius of the outer edge of the B ring (white) are all indicated.

The images were re-projected into the same viewing geometry and magnified by a factor of two to increase visibility of features. Image scale was about 2 kilometers (about 1 mile) per pixel in the original images. These images have not been cleaned of cosmic rays that struck the camera's sensor during exposure. These cosmic ray hits appear as small white streaks on the images.

The view looks toward the southern, sunlit side of the rings from about 44 degrees below the ring plane.

The images were taken in visible light with the Cassini spacecraft narrow-angle camera on January 28, 2008. The view was acquired at a distance of approximately 424,000 kilometers (264,000 miles) from Saturn and at a Sun-Saturn-spacecraft, or phase, angle of 52 degrees.

Video credit: NASA/JPL/Space Science Institute

Note: For a similar article and video, see PIA12795: Oscillations at B Ring Edge.

Sunday, November 14, 2010

Long Spiky Shadows


Vertical structures in the variable outer edge of Saturn's B ring cast shadows in these two images captured by NASA's Cassini spacecraft shortly after the planet's August 2009 northern vernal equinox.

In these two images, Cassini's narrow angle camera captured a 20,000-kilometer-long (12,000-mile-long) section arcing along the outer edge of the B ring in Saturn's rings. This particular section of the ring is known to be the site of vertical structures as tall as 3.5 kilometers (2.2 miles). See PIA11668 to learn more.

The B ring is shown at the top of both frames. The Cassini Division, a low-density ring region that separates the B ring from the A ring, runs from the bottom right to the upper left of the images. The A ring is at the bottom.

Cassini imaging scientists have concluded that this region and another in this vicinity are the sites of massive bodies, or moonlets, embedded near the ring's edge but independently orbiting Saturn. In the particular region shown in this image, the moonlets are likely big enough to cause ring material streaming past them to be excessively compressed and thrown vertically as a result.

This interpretation is supported by Cassini's previous discovery of a moonlet embedded in this region of the B ring (see PIA11665). The imaged moonlet, whose size is estimated at 300 meters (1,000 feet) across, was found only because it was betrayed by the shadow it cast during Saturn's August 2009 equinox period.

This image and others like it are only possible around the time of Saturn's equinox which occurs every half-Saturn-year (equivalent to about 15 Earth years). The illumination geometry that accompanies equinox lowers the Sun's angle to the ring plane and causes structures jutting out of the plane to cast long shadows across the rings. Cassini's cameras have spotted not only the predictable shadows of some of Saturn's moons (see PIA11657), but also the shadows of newly revealed vertical structures in the rings themselves (see PIA11654).

Both panels were re-projected to the same viewing geometry. The right-hand panel is a mosaic of two images. The images of the right-hand panel were taken in visible light with the Cassini spacecraft narrow-angle camera on August 19, 2009. Two stars are visible.

The left-hand panel was taken in visible light with the Cassini spacecraft narrow-angle camera on August 16, 2009. One star is visible.

This view looks toward the northern, sunlit side of the rings from about 11 degrees above the ring plane at a distance of approximately 2.3 million kilometers (1.4 million miles) from Saturn. Image scale is 13 kilometers (8 miles) per pixel.

Photo credit: NASA/JPL/Space Science Institute

Tuesday, November 9, 2010

Mimas


The Cassini spacecraft turns the eye of its camera toward Saturn's moon Mimas and spies the large Herschel Crater which itself looks like the iris of an eye peering out into space.

Herschel Crater is 130 kilometers, or 81 miles, wide and covers most of the right of this image. Scientists continue to study this impact basin and its surrounding terrain (see PIA12568).

Lit terrain seen here is on leading hemisphere of Mimas (396 kilometers, or 246 miles across). North on Mimas is up and rotated 1 degree to the left.

The image was taken in visible light with the Cassini spacecraft narrow-angle camera on October 16, 2010. The view was obtained at a distance of approximately 103,000 kilometers (64,000 miles) from Mimas and at a Sun-Mimas-spacecraft, or phase, angle of 113 degrees. Image scale is 613 meters (2,011 feet) per pixel.

Photo credit: NASA/JPL/Space Science Institute

Tuesday, November 2, 2010

Rings Around Crescent Saturn


A crescent Saturn appears nestled within encircling rings in this Cassini spacecraft image.

Clouds swirl through the atmosphere of the planet. Prometheus (86 kilometers, or 53 miles across) orbits between the main rings and the thin F ring, and this moon appears as a speck above the rings near the middle of the image.

This view looks toward the southern, unilluminated side of the rings from about 3 degrees below the ringplane.

The image was taken with the Cassini spacecraft wide-angle camera on September 14, 2010 using a spectral filter sensitive to wavelengths of near-infrared light centered at 890 nanometers. The view was obtained at a distance of approximately 2.6 million kilometers (1.6 million miles) from Saturn and at a Sun-Saturn-spacecraft, or phase, angle of 100 degrees. Image scale on Saturn is 151 kilometers (94 miles) per pixel.

Photo credit: NASA/JPL/Space Science Institute

Tuesday, October 26, 2010

Shadows of the Rings and Mimas


Saturn's moon Mimas casts a elliptical shadow on the planet south of the larger, wider shadows cast by the planet's rings.

Mimas and the rings are not shown here. This view looks toward the southern hemisphere of the planet.

The image was taken with the Cassini spacecraft narrow-angle camera on September 8, 2010 using a spectral filter sensitive to wavelengths of near-infrared light centered at 750 nanometers. The view was obtained at a distance of approximately 2.2 million kilometers (1.4 million miles) from Saturn and at a Sun-Saturn-spacecraft, or phase, angle of 82 degrees. Image scale is 13 kilometers (8 miles) per pixel.

Photo credit: NASA/JPL/Space Science Institute

Monday, October 18, 2010

Rings, Rhea and Telesto


This Cassini spacecraft composition features Saturn's rings, its second largest moon, Rhea, and one of the planet's tiny moons, Telesto.

Rhea (1,528 kilometers, or 949 miles across) is on the right. Telesto (25 kilometers, or 16 miles across) is near the middle of the image and appears as a bright speck. Saturn's rings are at the top of the image. The rings and Telesto have been brightened by a factor 1.6 relative to Rhea.

This view looks toward the southern, unilluminated side of the rings from just below the ringplane.

The image was taken in visible light with the Cassini spacecraft narrow-angle camera on September 5, 2010. The view was acquired at a distance of approximately 1.6 million kilometers (994,000 miles) from Telesto and 1.9 million kilometers (1.2 million miles) from Rhea. Image scale is 10 kilometers (6 miles) per pixel on Telesto and 11 kilometers (7 miles) per pixel on Rhea.

Photo credit: NASA/JPL/Space Science Institute