Showing posts with label Cairo Sulcus. Show all posts

Wednesday, July 30, 2014

Enceladus Geysers


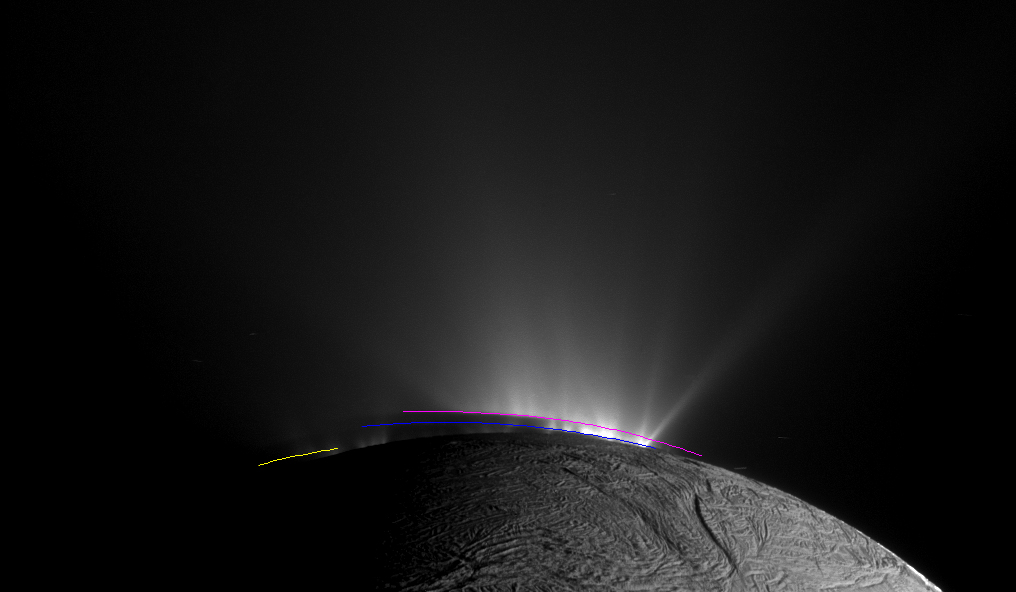
This Cassini narrow-angle camera image -- one of those acquired in the survey conducted by the Cassini imaging science team of the geyser basin at the south pole of Enceladus -- was taken as Cassini was looking across the moon's south pole. At the time, the spacecraft was essentially in the moon's equatorial plane. The image scale is 1280 feet (390 meters) per pixel and the sun-Enceladus-spacecraft, or phase, angle is 162.5 degrees.

The image was taken through the clear filter of the narrow angle camera on November 30, 2010, 1.4 years after southern autumnal equinox. The shadow of the body of Enceladus on the lower portions of the jets is clearly seen.

In an annotated version of the image, the colored lines represent the projection of Enceladus' shadow on a plane normal to the branch of the Cairo fracture (yellow line), normal to the Baghdad fracture (blue line) and normal to the Damascus fracture (pink line).

Post-equinox images like this, clearly showing the different projected locations of the intersection between the shadow and the curtain of jets from each fracture, were useful for scientists in checking the triangulated positions of the geysers, as described in a paper by Porco, DiNino, and Nimmo, and published in the online version of the Astronomical Journal in July 2014: http://dx.doi.org/10.1088/0004-6256/148/3/45.

A companion paper, by Nimmo et al. is available at: http://dx.doi.org/10.1088/0004-6256/148/3/46.

Image credit: NASA/JPL-Caltech/Space Science Institute

Note: For more information, see 101 Geysers on Icy Saturn Moon.

Friday, December 3, 2010

Enceladus Tiger Stripe Hot Spots


This image shows a high-resolution heat intensity map of part of the south polar region of Saturn's moon Enceladus, made from data obtained by NASA's Cassini spacecraft.

The map reveals never-before-seen details of warm fractures that branch off like split ends from the ends of the main trenches of two "tiger stripes." The features nicknamed "tiger stripes" are long fissures that spray water vapor and icy particles. These two fissures, Cairo Sulcus (left) and Alexandria Sulcus (right), extend to the lower right, off the bottom of the image. The map also shows an intriguing isolated warm spot, shown in purple-red in the upper left of the image, that is separated from other active fissures.

The thermal data came from Cassini's composite infrared spectrometer during an August 13, 2010, flyby of Enceladus. Scientists overlaid the data on a background map of that region made from Cassini images taken in July 2005. The intensity of thermal radiation, measured at wavelengths from 12 to 16 microns, is color-coded, with dark blue, purple, red and orange denoting progressively more intense radiation, due to higher temperatures and/or larger expanses of warm material. The pale blue color indicates regions that were mapped but that were too cold to emit significant radiation. Alignment of the thermal map with the underlying base map is approximate. The map shows a region approximately 130 kilometers (80 miles) across.

These data were obtained as winter darkness began to engulf the south polar region of Enceladus. Away from the warm tiger stripes, which reach temperatures up to 190 Kelvin (minus 120 degrees Fahrenheit), Cassini measured surface temperatures near Enceladus' south pole as low as 52 Kelvin (minus 365 degrees Fahrenheit), and still colder temperatures are expected as winter advances. Scientists are still analyzing the data to calculate a temperature for the cross-cutting fractures and the isolated warm spot.

Image credit: NASA/JPL/GSFC/SWRI/SSI