Showing posts with label Sulcus/Sulci. Show all posts

Thursday, July 31, 2014

Elevated View of Enceladus' South Pole


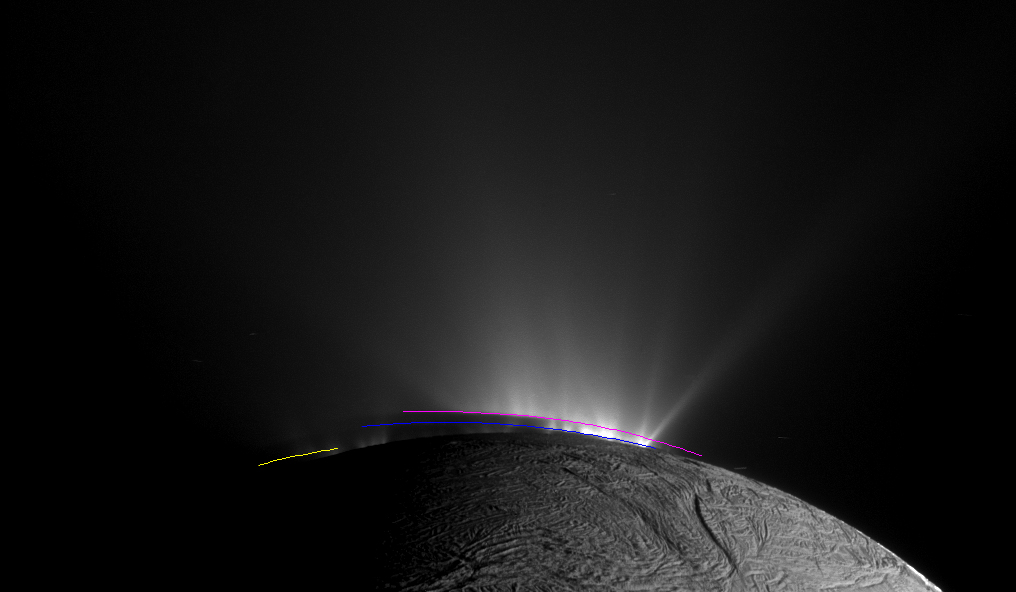
This dramatic view looks across the region of Enceladus' geyser basin and down on the ends of the Baghdad and Damascus fractures that face Saturn. The image, which looks approximately in the direction of Saturn, was taken from a more elevated viewpoint than other Cassini survey images of this area of the moon's south pole.

The geysering segments of the fractures seen here are among the most active and warmest in the whole region. As seen from the spacecraft from an elevation angle of 25 degrees south, the jets are projected against the bright surface as opposed to black sky. Consequently, despite the pronounced activity, the jets appear fuzzy, or indistinct, in this image and their tilts are consequently not measurable. Though their source locations are clearly seen, this image was not used in the process of triangulation, but instead it was used to confirm source locations determined from triangulation using other images.

The image was taken with Cassini's narrow-angle camera through the clear filter on August 13, 2010, with an image scale about 230 feet (70 meters) per pixel and a Sun-Enceladus-spacecraft, or phase, angle of about 151 degrees.

This image was one of those used to confirm the sources of Enceladus' geysers as described in a paper by Porco, DiNino, and Nimmo, and published in the online version of the Astronomical Journal in July 2014: http://dx.doi.org/10.1088/0004-6256/148/3/45.

A companion paper, by Nimmo et al. is available at: http://dx.doi.org/10.1088/0004-6256/148/3/46.


Image credit: NASA/JPL-Caltech/Space Science Institute

Note: For more information, see PIA17186: Geyser Basin in 3-D, PIA17187: Enceladus' Plume Brightness Variations, PIA17188: Surveyor's Map of Enceladus' Geyser Basin, PIA17189: What Lies Beneath: Close Up View (Artist's Concept), PIA17190: What Lies Beneath: Regional View (Artist's Concept), and Cassini Spacecraft Reveals 101 Geysers and More on Icy Saturn Moon.

Wednesday, July 30, 2014

Enceladus Geysers


This Cassini narrow-angle camera image -- one of those acquired in the survey conducted by the Cassini imaging science team of the geyser basin at the south pole of Enceladus -- was taken as Cassini was looking across the moon's south pole. At the time, the spacecraft was essentially in the moon's equatorial plane. The image scale is 1280 feet (390 meters) per pixel and the sun-Enceladus-spacecraft, or phase, angle is 162.5 degrees.

The image was taken through the clear filter of the narrow angle camera on November 30, 2010, 1.4 years after southern autumnal equinox. The shadow of the body of Enceladus on the lower portions of the jets is clearly seen.

In an annotated version of the image, the colored lines represent the projection of Enceladus' shadow on a plane normal to the branch of the Cairo fracture (yellow line), normal to the Baghdad fracture (blue line) and normal to the Damascus fracture (pink line).

Post-equinox images like this, clearly showing the different projected locations of the intersection between the shadow and the curtain of jets from each fracture, were useful for scientists in checking the triangulated positions of the geysers, as described in a paper by Porco, DiNino, and Nimmo, and published in the online version of the Astronomical Journal in July 2014: http://dx.doi.org/10.1088/0004-6256/148/3/45.

A companion paper, by Nimmo et al. is available at: http://dx.doi.org/10.1088/0004-6256/148/3/46.

Image credit: NASA/JPL-Caltech/Space Science Institute

Note: For more information, see 101 Geysers on Icy Saturn Moon.

Saturday, December 3, 2011

Southern Enceladus in Radar View


NASA's Cassini spacecraft obtained these views of the south polar area of Saturn's moon Enceladus in visible and near-visible (ultraviolet and infrared) light and synthetic-aperture radar (SAR). The region is south of 45 degrees South latitude. The SAR image, acquired November 6, 2011, is shown as an arc running from upper left to lower right, accented in light blue. Bright and dark edges of this arc are artifacts of the radar imaging process. The background image was taken with visible-light (PIA08342), with color added for emphasis (see below). Visible-light images, like we normally see in photographs, are mostly bright or dark depending on their target's chemical composition, while brightness in SAR images usually depends on how rough or smooth the surface is. The SAR swath is about 15 miles (25 kilometers) wide and is centered at 655 South latitude, 295 West longitude.

The color in the background image is used to separate different materials using ultraviolet, visible and infrared images taken from 2004 to 2009 (see PIA13423). Blue colors represent icy material that originated in the plumes and fell back to the surface. Since these images were taken using illumination by sunlight, they sense ice particles and other roughness in the wavelength range of 50 to 100 microns. The SAR swath uses microwaves 2 centimeters long in wavelength to "light" the surface, so it senses roughness in that range. In addition, the SAR may be seeing that roughness slightly under the surface.

From east-to-west (bottom right to top left), the SAR image crosses near-south-polar terrain close to many of the active sulci, which are long fissures. Throughout the scene, the surface is covered with a network of linear and near-linear grooves and fractures, interpreted to be due to extension, or pulling apart, of Enceladus' crust. These are dominated by a set of larger grooves, about a mile (kilometer) wide, running many tens of miles (kilometers) in length, and smaller grooves about 700 feet (200 meters) wide. A v-shaped region near the lower (eastern) end of the SAR swath, bounded by large faults, appears brighter to radar than most other areas, most likely the result of a rougher surface in the 2-centimeter-wavelength scale. Within, the terrain appears to be slightly more broken up, possibly the result of more dynamic tectonic forces disrupting the surface. The few-miles-wide (few-kilometers-wide) fault bounding the westernmost edge (top) edge of this area looks similar to the four active sulci that run parallel to it, suggesting that it is formed by the same processes; this feature is discussed in PIA15171. A similar fault about 1 to 2 miles (2 to 3 kilometers) wide runs along the center of much of the SAR swath for at least 47 miles (75 kilometers). Farther west still, the swath crosses another v-shaped, SAR-bright region bounded by large faults, including part of the Mosul Sulci system (see PIA15170). Once again, the network of fractures within the bright region appear to be rougher and more broken up. It also coincides with unusually colored terrain surrounding the active sulci (seen in the background images), and so possibly indicates a relatively young or active surface.

Photo credit: NASA/JPL-Caltech/Space Science Institute

Note: For other images in this series, see PIA15170: Enceladus Sparkle and PIA15171: Groovy Enceladus.

Sunday, December 5, 2010

Damascus Sulcus Hot Spot


Data from NASA's Cassini spacecraft have enabled scientists to make the highest-resolution heat intensity maps yet for the hottest part of a "tiger stripe" fissure on Saturn's moon Enceladus. The moon's south polar region features several of these long fissures that spray water and icy particles, and the one in this image is called Damascus Sulcus.

The thermal infrared data, shown in color, come from Cassini's composite infrared spectrometer (CIRS). The grayscale background image, which is illuminated by light reflected from Saturn rather than by direct sunlight, is from Cassini's high-resolution imaging camera (ISS). The CIRS scan gives scientists confidence that the peak temperature along Damascus Sulcus, the most active tiger stripe, was about 190 Kelvin (minus 120 degrees Fahrenheit). This temperature is slightly higher than the previous maximum temperatures measured by CIRS at Damascus, which were around 170 Kelvin (minus 150 degrees Fahrenheit).

The intensity of heat radiation, measured by CIRS at wavelengths from 7 to 9 microns, is color-coded, with blue, purple, red, orange and yellow denoting progressively more intense radiation, due to higher temperatures and/or larger expanses of warm material. The image is centered near 80 degrees South latitude and 315 degrees West longitude, and covers a region about 16 kilometers (10 miles) wide. The smallest details seen in the CIRS overlay are about 800 meters (0.5 miles) in size.

The region of peak temperature is sharply bounded by the sides of the trench. Thanks to its high resolution, the CIRS map also shows for the first time that the regions on either side of the central trench are also radiating heat (shown as blue strips flanking the central multicolored strip in this image). CIRS measured temperatures of about 120 Kelvin (minus 240 degrees Fahrenheit) in the flanking regions about 400 to 1,200 meters (a quarter to three-quarters of a mile) away from the central trench.

These data were obtained on August 13, 2010 as the south pole of Enceladus began to go into winter darkness.

Photo credit: NASA/JPL/GSFC/SWRI/SSI

Friday, December 3, 2010

Enceladus Tiger Stripe Hot Spots


This image shows a high-resolution heat intensity map of part of the south polar region of Saturn's moon Enceladus, made from data obtained by NASA's Cassini spacecraft.

The map reveals never-before-seen details of warm fractures that branch off like split ends from the ends of the main trenches of two "tiger stripes." The features nicknamed "tiger stripes" are long fissures that spray water vapor and icy particles. These two fissures, Cairo Sulcus (left) and Alexandria Sulcus (right), extend to the lower right, off the bottom of the image. The map also shows an intriguing isolated warm spot, shown in purple-red in the upper left of the image, that is separated from other active fissures.

The thermal data came from Cassini's composite infrared spectrometer during an August 13, 2010, flyby of Enceladus. Scientists overlaid the data on a background map of that region made from Cassini images taken in July 2005. The intensity of thermal radiation, measured at wavelengths from 12 to 16 microns, is color-coded, with dark blue, purple, red and orange denoting progressively more intense radiation, due to higher temperatures and/or larger expanses of warm material. The pale blue color indicates regions that were mapped but that were too cold to emit significant radiation. Alignment of the thermal map with the underlying base map is approximate. The map shows a region approximately 130 kilometers (80 miles) across.

These data were obtained as winter darkness began to engulf the south polar region of Enceladus. Away from the warm tiger stripes, which reach temperatures up to 190 Kelvin (minus 120 degrees Fahrenheit), Cassini measured surface temperatures near Enceladus' south pole as low as 52 Kelvin (minus 365 degrees Fahrenheit), and still colder temperatures are expected as winter advances. Scientists are still analyzing the data to calculate a temperature for the cross-cutting fractures and the isolated warm spot.

Image credit: NASA/JPL/GSFC/SWRI/SSI